Performance
The Performance card shows how fast your homepage loads on desktop and mobile, measured by Google PageSpeed Insights. Scores refresh automatically; click the refresh icon to run a new check on demand.
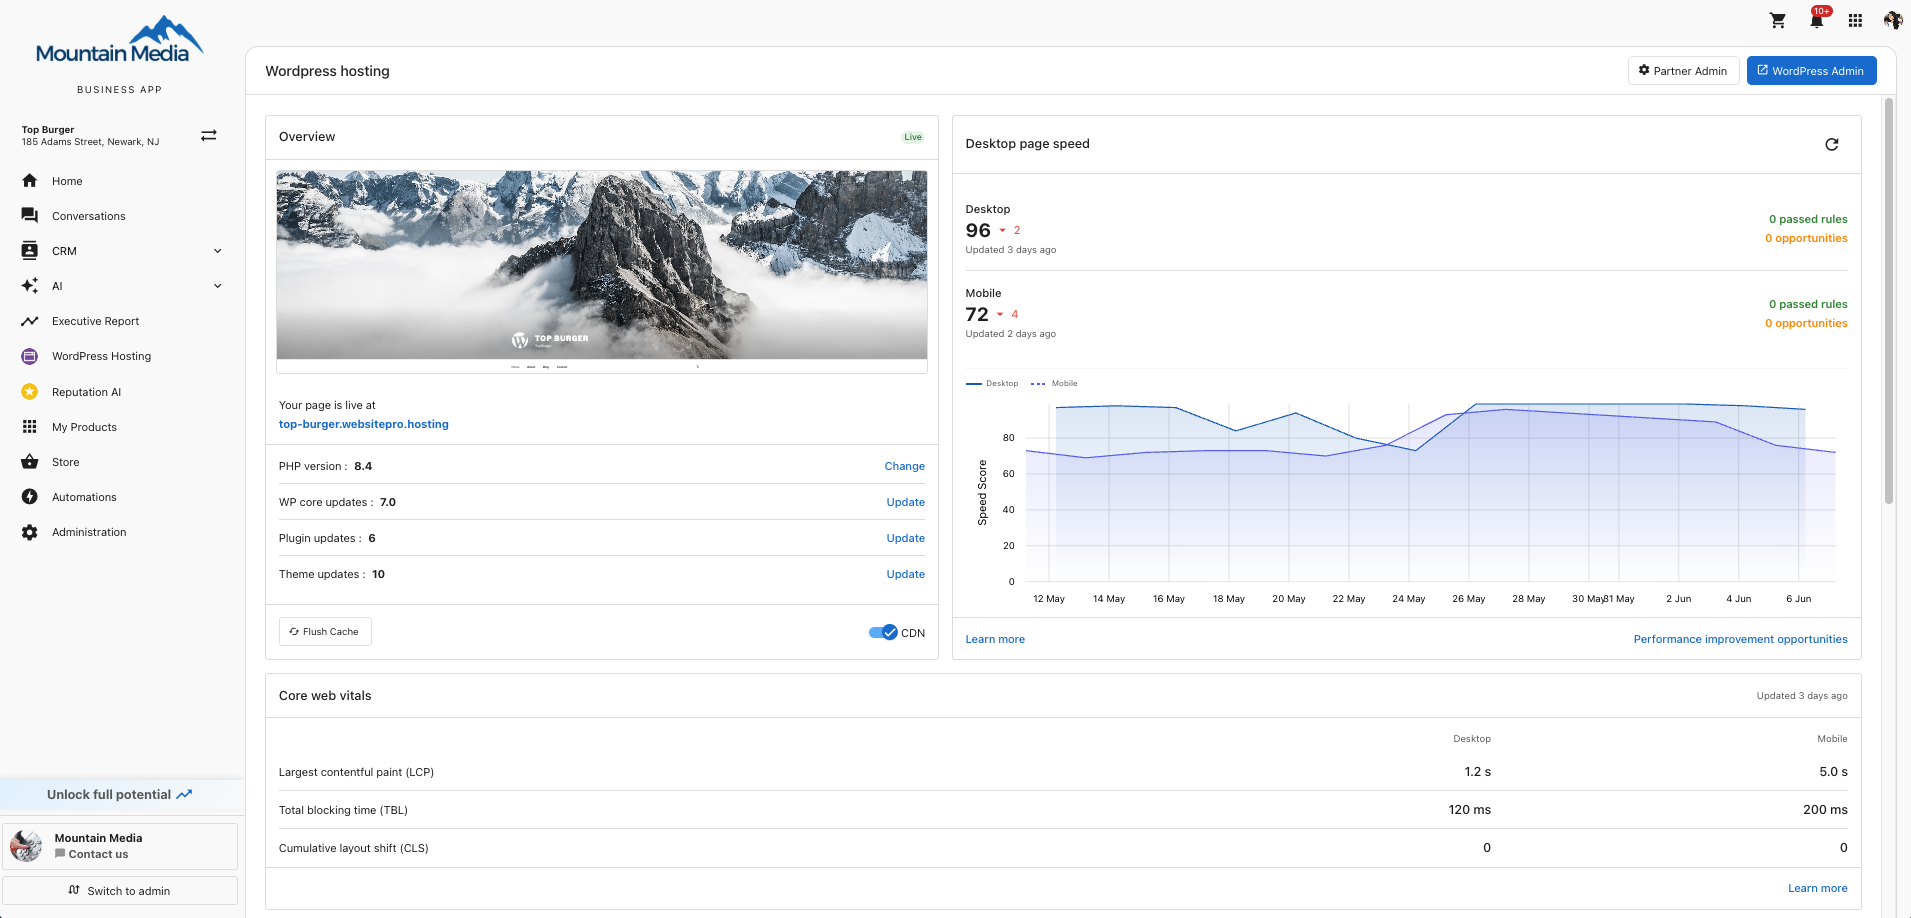
What you see
- Desktop and Mobile scores — A 0–100 number for each. The arrow next to the score shows how much it changed since the last check.
- Passed rules — PageSpeed checks your site already satisfies.
- Opportunities — Suggested fixes that could raise your score.
- History chart — Desktop (solid line) and mobile (dashed line) scores plotted over time.
- Performance improvement opportunities — Opens a detailed list of fixes with estimated time savings.
Score ranges
Google PageSpeed Insights uses the same scoring scale for desktop and mobile, but realistic targets are different because mobile devices have less processing power and slower networks.
Desktop
| Score | Rating | What it means |
|---|---|---|
| 90–100 | Good | Aim here. Most visitors get a fast experience. |
| 50–89 | Needs improvement | Some visitors will notice slow loading. |
| 0–49 | Poor | Most visitors will experience a slow site. |
Mobile
| Score | Rating | What it means |
|---|---|---|
| 70–100 | Good | A strong mobile experience. |
| 50–69 | Needs improvement | Average. There are likely a few easy wins. |
| 0–49 | Poor | Mobile visitors are leaving before the page loads. |
Improve your score
The fastest wins for most sites:
- Compress and resize large images.
- Enable the CDN if it's not already on.
- Remove unused plugins and heavy third-party scripts.
- Test changes on staging before publishing.
tip
After making a change you expect to improve performance, click the refresh icon to measure right away instead of waiting for the next automatic update.