Analytics Dashboard with SSO
A protected analytics dashboard is one of Vibe's more compelling use cases: a private area where the business owner or their team can sign in and see live performance data pulled directly from their Business App account. This example walks through building a review analytics dashboard with single sign-on authentication, using real reputation data from the account.
Before you start
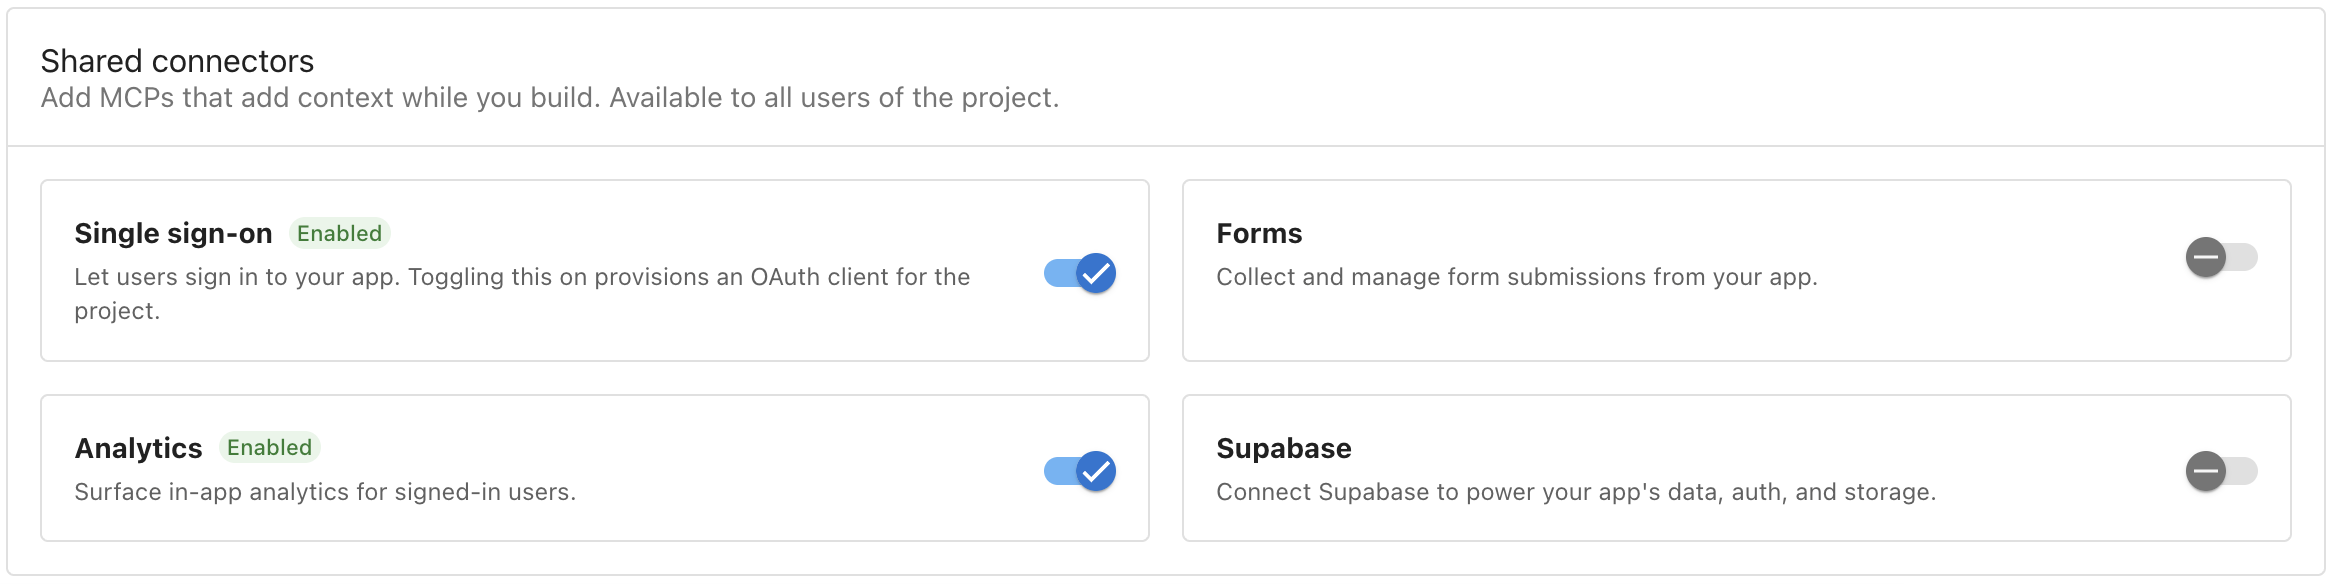
This use case requires two connectors, enabled in the correct order. Open Connectors from the project — either via Configure on the project card or + in the chat box — and turn them on in this sequence:
- Toggle Single sign-on on first.
- Toggle Analytics on.
SSO must come first. The Analytics connector pulls data from authenticated APIs scoped to the signed-in user, and without an active SSO session those requests have nothing to run against. Both need to be on before you run any of the prompts below.
Step 0: Build a page to host the dashboard (optional)
If you want the dashboard to live inside a landing page or a broader website rather than as a standalone screen, build that first. Describe the layout and content you want to Vibe and let it generate the page before adding authentication and data. This use case does not cover building a landing page. See Campaign Landing Page with Lead Capture for an example of that.
Step 1: Set up authentication
Build the login layer first, before adding any data. Keeping authentication and data as separate prompts makes it easier to verify each piece is working before moving on.
Using SSO, I would like to create an authenticated dashboard area. Open the sign-in flow in a pop-up window so it works when the page is embedded. Display a user profile badge to show that they are logged in, and for now nothing else.
If you built a page in Step 0, Vibe adds a sign-in option to its navbar. If you are starting from scratch with no existing page, Vibe creates a standalone sign-in panel. Either way, when a user clicks sign in, a pop-up window opens for the sign-in flow. Once authenticated, the pop-up closes and the user's name appears in the profile badge to confirm they are signed in.
Who can sign in: Only users who are already members of the Business App account can authenticate. This is not an open login; people outside the business cannot sign in, even with a valid email address.

Sign-in option added to the navbar
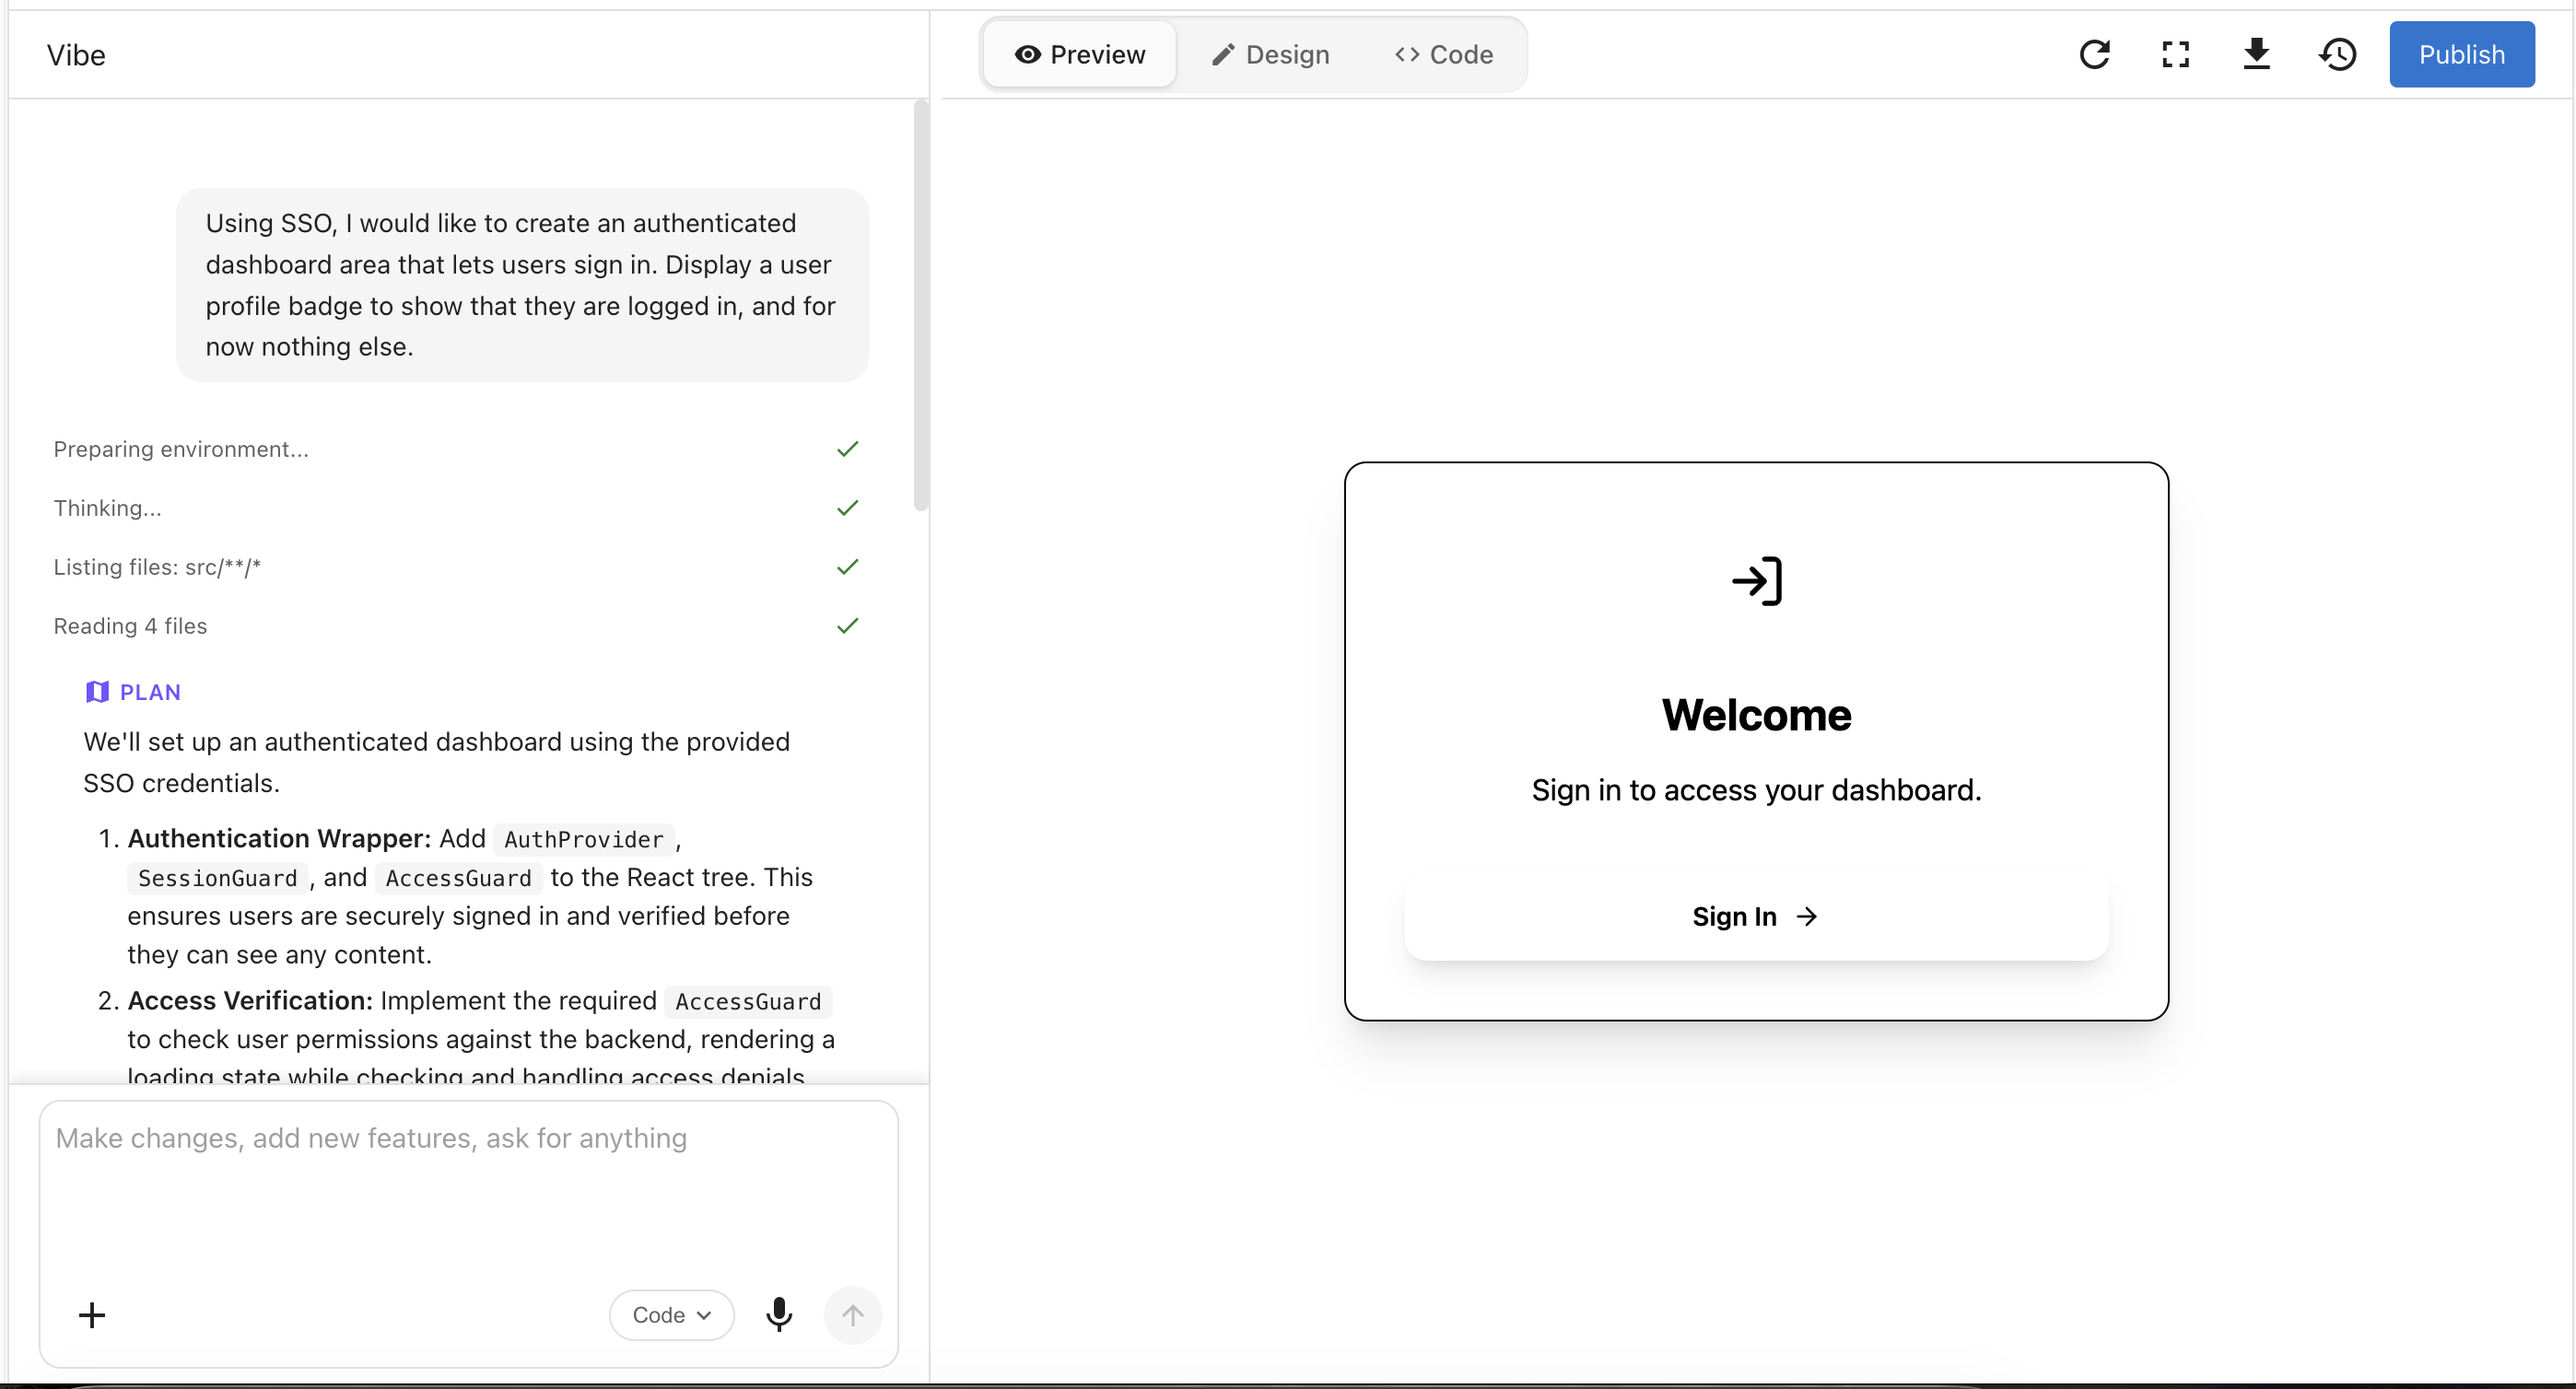
Standalone sign-in panel
If you see "refused to connect" when signing in: This happens when the sign-in flow is not set up to open in a pop-up window. The SSO provider blocks its login page from loading inside an iframe to prevent clickjacking attacks, and Vibe's built-in preview window runs inside one. To sign in during testing, open your browser's Developer Tools (right-click anywhere on the page and select Inspect, or press F12), then use the search function to look for sandbox. This will surface the Vibe app's URL in the page source. Right-click the link and open it in a new tab. This breaks the page out of the iframe and lets you sign in with your Business App credentials normally. When the dashboard is published, it runs as a standalone page and the restriction does not apply.
Step 2: Add analytics data
Once authentication is confirmed working, add the data. Vibe pulls from the same metrics that power the Executive Report, so any stat visible there is available here.
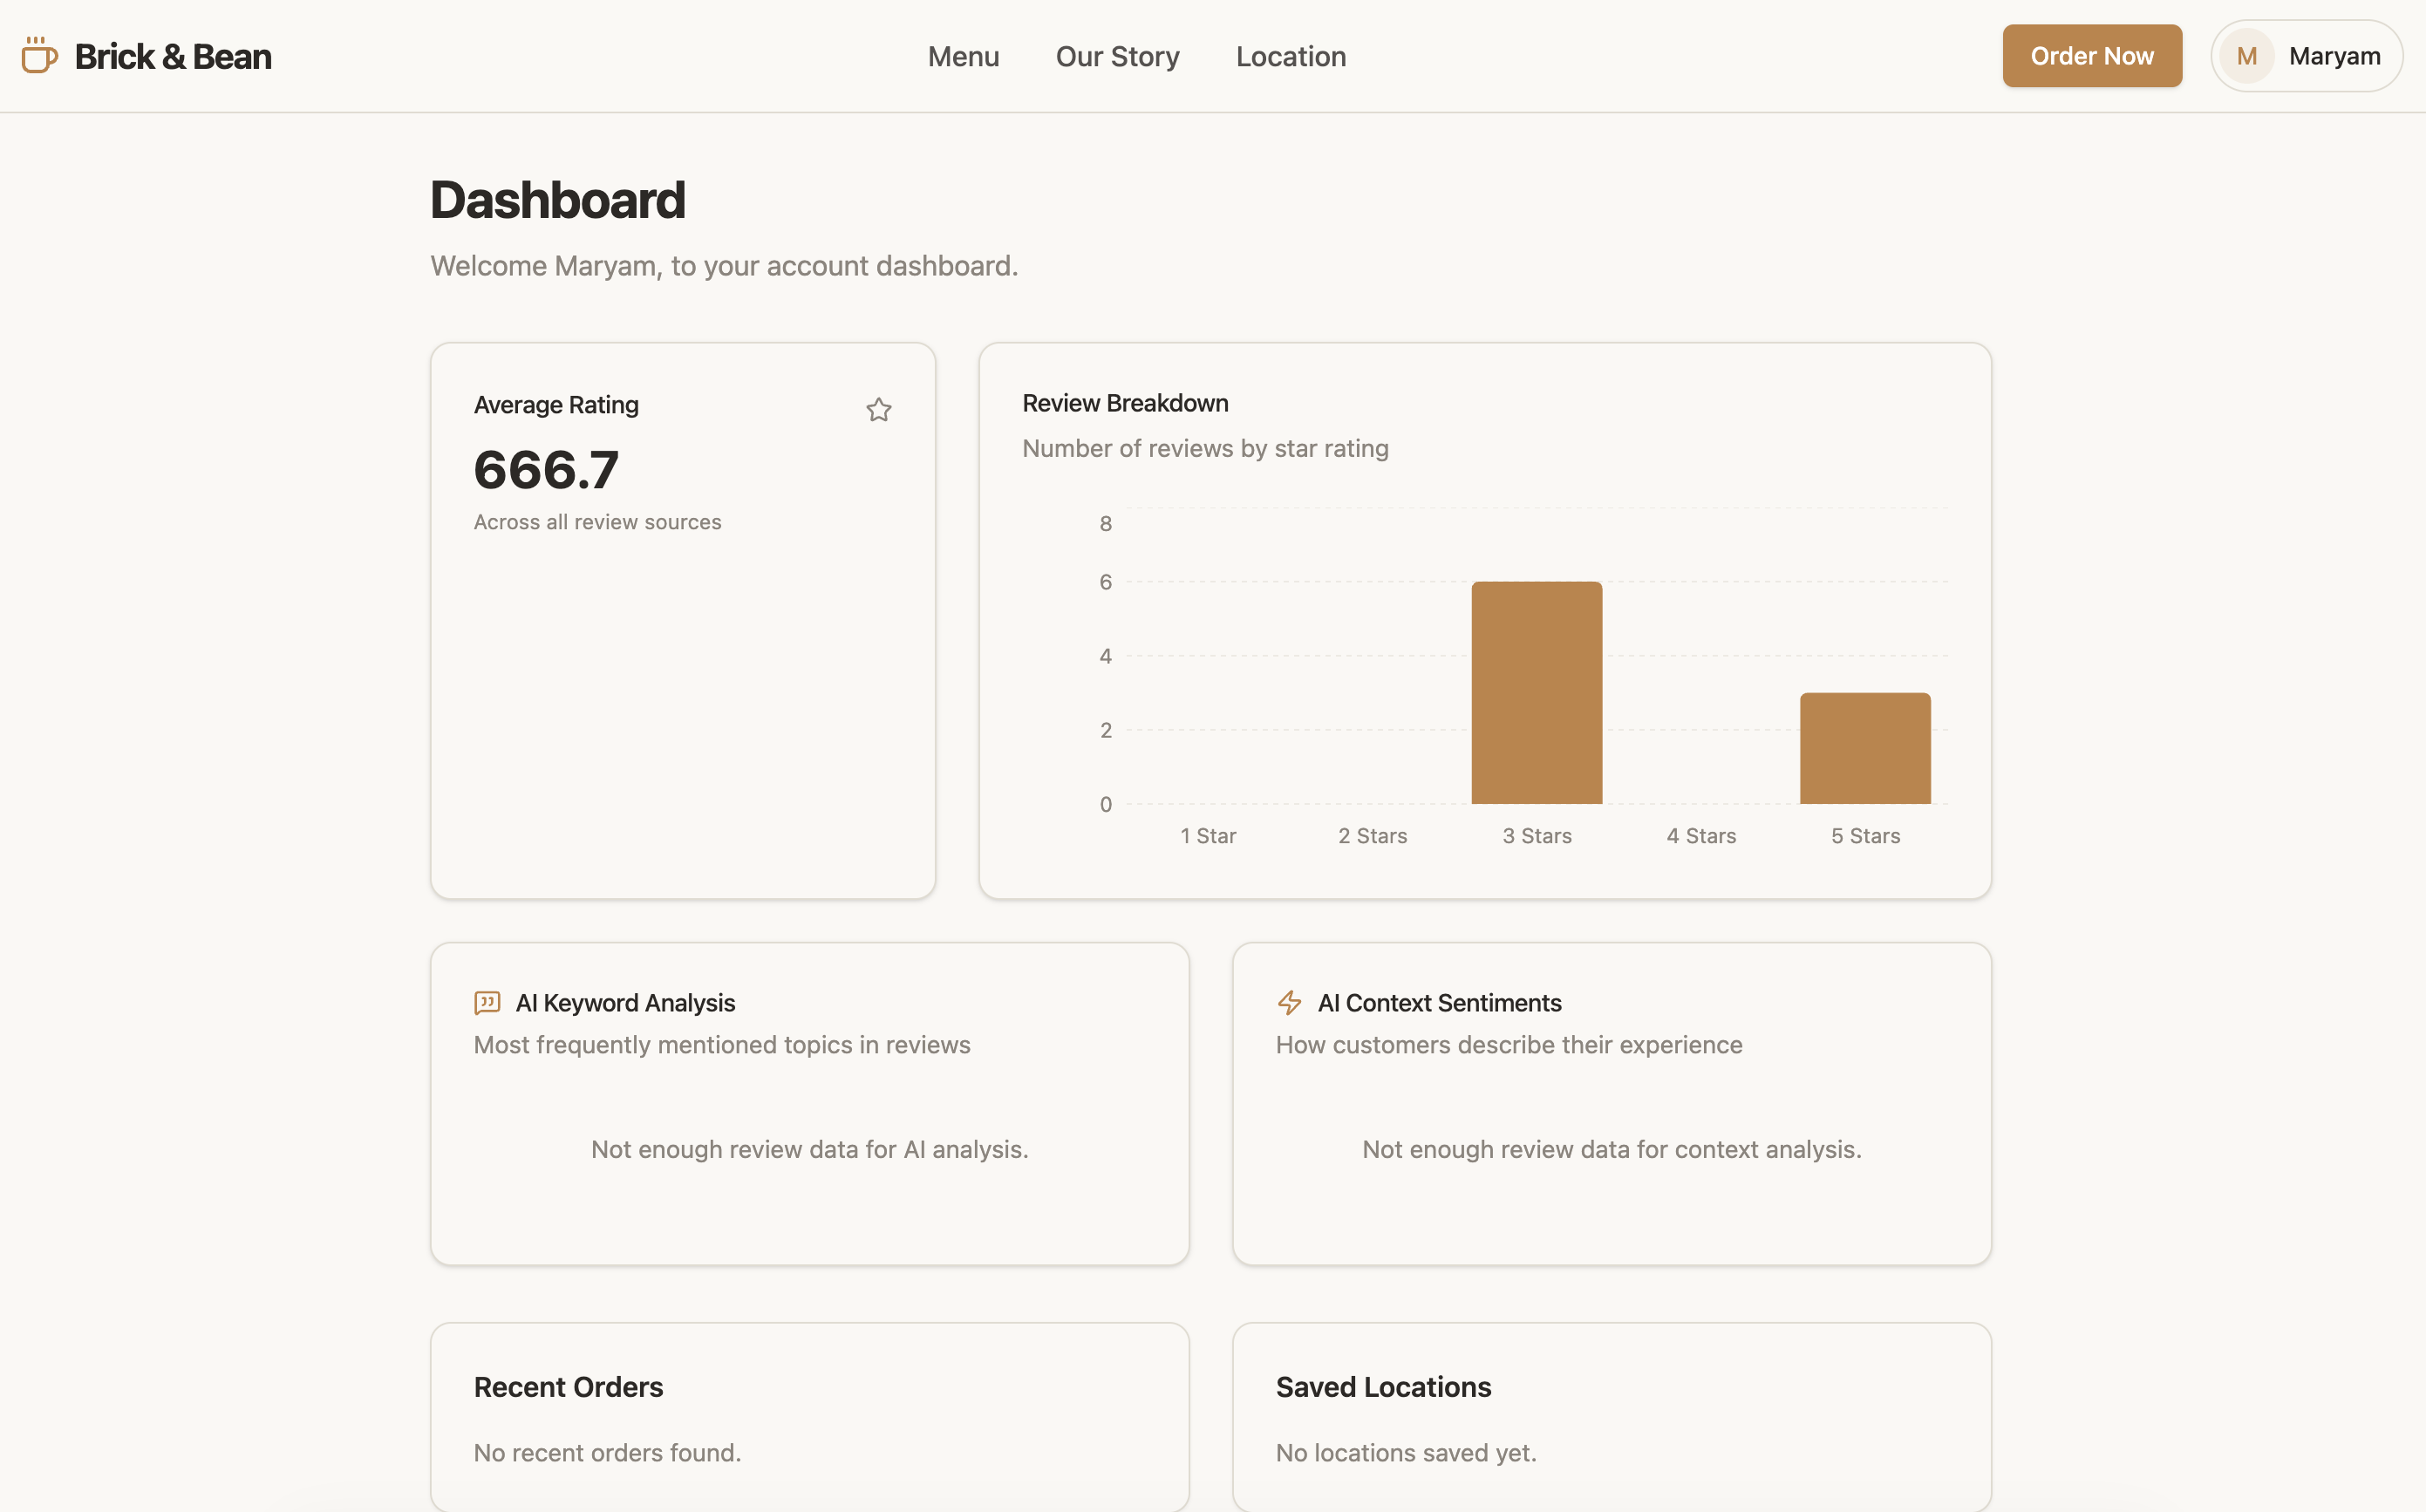
Using Reputation AI metrics, show my average review rating for the last 90 days. Also add a bar chart that breaks down the total number of reviews received in that time period by star rating, from one to five stars.
From that prompt, Vibe produces:
- An average review rating KPI card for the past 90 days
- A bar chart showing how many reviews landed at each star rating (1–5)
The data is live and reflects actual reviews in the account, not placeholder values.
You can display any metric available in the Executive Report tab of Business App. Describe what you want in plain language and Vibe will pull the right data.
Step 3: Add a review breakdown table
Beneath the review rating cards, add a table breakdown of the individual reviews themselves.
Vibe adds a table listing each review with its source (Google, Facebook, etc.). Review text availability depends on the platform.
What made this work
Authentication before data. Running the SSO prompt first, with no data in it, kept the two concerns separate. If the login flow doesn't work, the SSO connector setup is the issue, not an analytics query. Mixing both into one prompt makes problems much harder to trace.
Building incrementally. Each prompt added one piece. Starting with authentication, then a chart, then a table made each step verifiable before moving to the next.
Tips for this use case
Many more metrics are available. Vibe has access to the full set of metrics that power the Executive Report: listings data, social activity, ad performance, and more. Use plain language to describe what you want:
Add a card showing my total new leads in the last 30 days.
Show a chart of my Google Business Profile views over the last six months.
If a metric appears in the Executive Report, it is likely available in Vibe.
This dashboard can be published to a custom domain. Once the layout is ready, publish from Vibe and point a domain at it. Business App handles TLS automatically with no certificate setup required. See Custom Domains for setup steps.